Spectroscopic Measurements – A Comparison of Different Cases
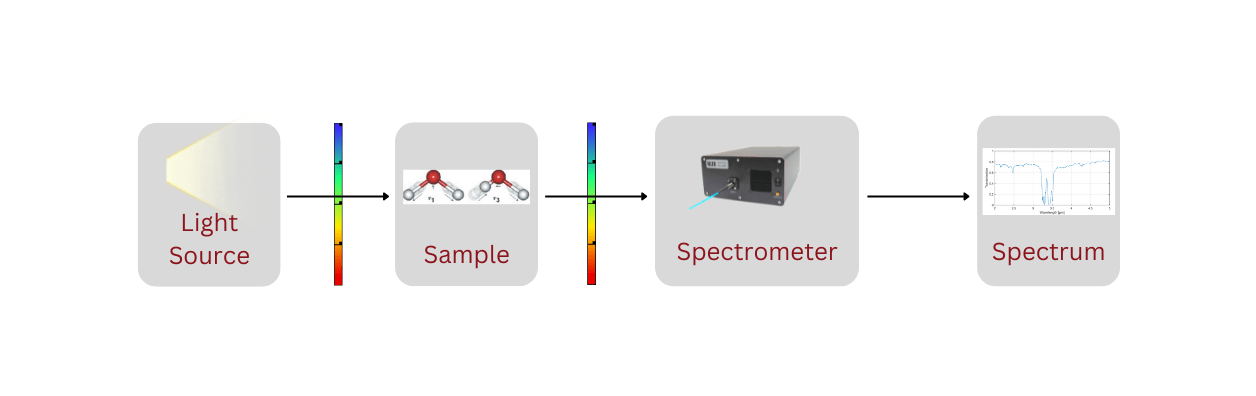
Spectroscopy is the study of how light interacts with different materials at different wavelengths. By measuring the amount of absorption and transmission of electromagnetic waves through a material, it is possible to determine the materials’ properties and analyze the light sources.
Light source
The light source is typically some kind of hot filament source or a globar that may emit light in the full spectrum ranging from the ultra-violet over the visible and up to the far infrared range. It might be a special source for a specific range to optimize the intensity, but it can also be a very broad source for more general measurements.
Light detection
The simplest way to detect light at specific wavelengths is to separate the light using a dispersive element such as a grating. In one implementation the signal is spread out onto an array of pixels, such as a CMOS chip. Each pixel corresponds to a specific wavelength and translates the incoming signal light into a set of signal intensities and wavelengths. This is called the spectrum of light. This detection method is called a grating spectrometer and the full spectrum is read out simultaneously. With the fastest instruments, it is possible to measure many thousands of times each second, allowing transmission spectroscopy to detect fast changes in the sample instantaneously.
In the following sections, we will discuss some different cases of spectroscopic measurements.
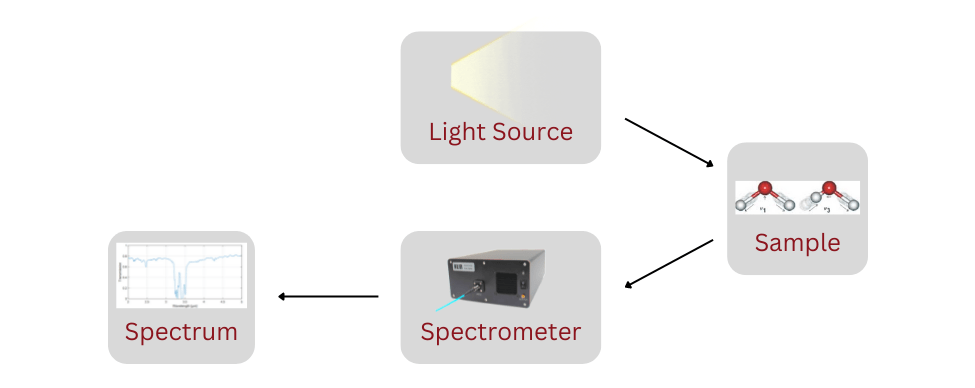
Case 1: Transmission spectroscopy
In this case, the setup consists of a light source and a spectrometer with a sample holder in between. This sample holder could be a flow cell with liquid flowing between two windows. The first step is to obtain a reference measurement with an empty flow cell. Secondly, a measurement series should be recorded while the flow is running in the cell. Third, a background measurement should be obtained with the light source completely blocked. Analyzing the data requires subtracting the background and comparing the empty cell measurements with the flow measurements, or using the optical transmission definition.
In this way, a time series of transmission spectra is collected for the flowing liquid, providing information on its spectral characteristics and how they change over time.
Transmission spectroscopy
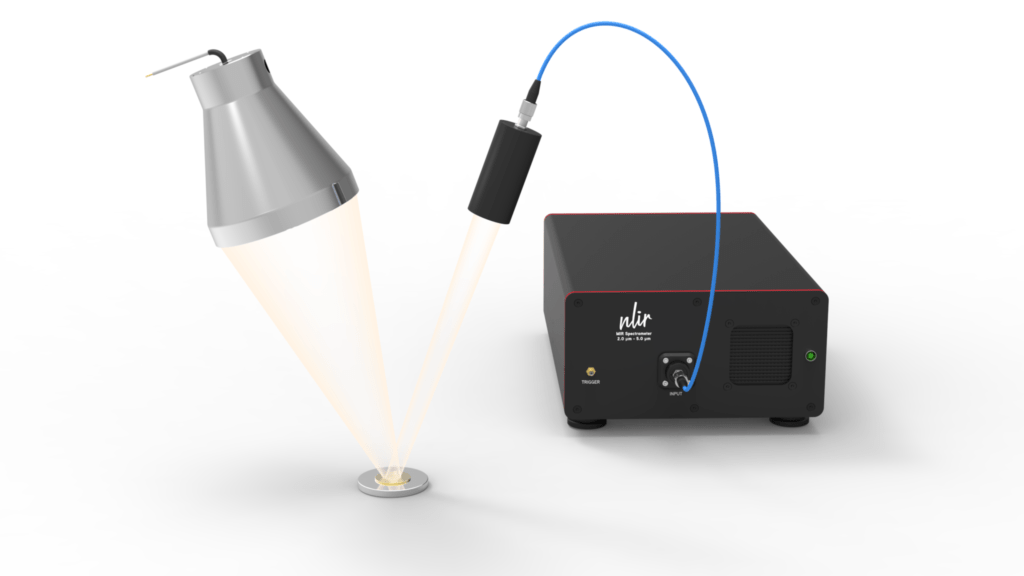
Case 2: Reflective spectroscopy
In this variation, the concept is the same, but instead of inserting the sample into the light path, the light source is reflected on a target. Spectrometers can detect that. The background measurement is obtained in the same way with the light source blocked, but the reference is obtained from a neutral reflection surface. That is a surface that reflects all wavelengths equally, e.g. a metallic mirror or a diffuse metallic surface. The reference target is then removed and replaced with the sample. In that way, the optical transmission calculation will result in the reflection spectra of the sample and provide specific spectral information about the surface.
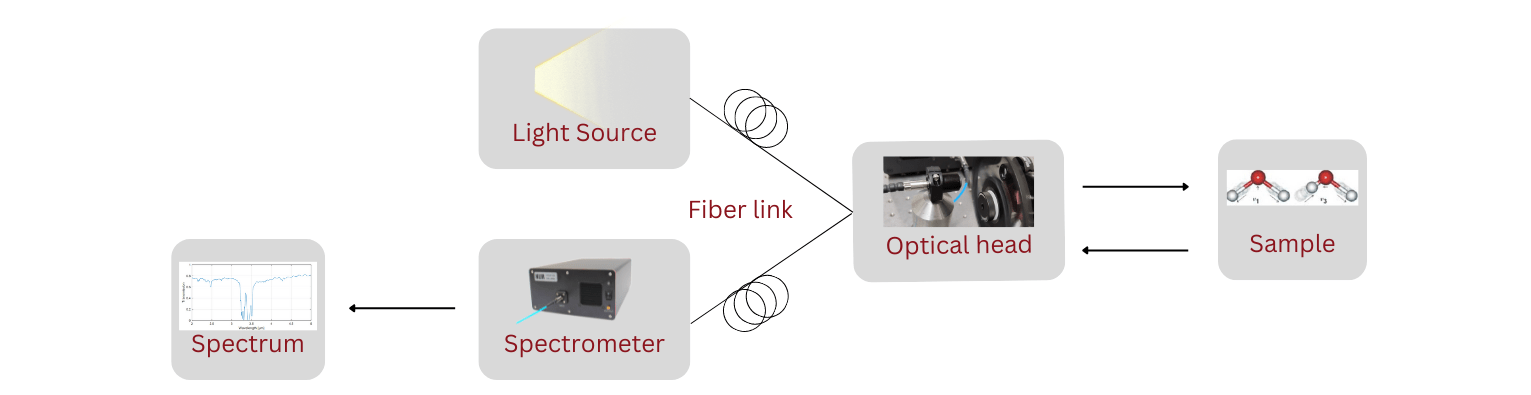
This example could include both transmission and reflection spectroscopy depending on the specific fiber probe. Furthermore many different designs could be implemented for specific measurement cases, but we have chosen a simple reflection probe for localized sampling. The light source in this case is fiber coupled and transmitted through a multimode fiber with a large core diameter. At the probe end, the light is collimated and then re-focused down to the target surface. From the target surface, the light is collected with a lens and focused onto another multimode fiber that guides the light to the spectrometer. The reflection measurement procedure is the same as for the basic reflection setup, but with the additional flexibility of fiber coupling.
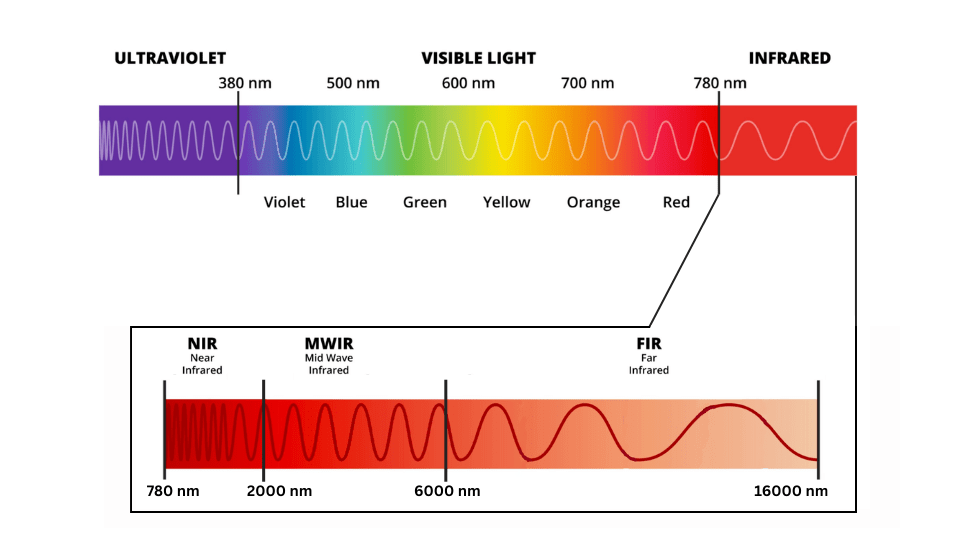
The interaction of infrared light with different kinds of matter is a special case of spectroscopy. This covers the range from near-infrared (900-2000 nm) over mid-infrared (2000 – 6000 nm) to the far infrared region (7000-16000 nm). The applications of each of these ranges are critical for industrial and research purposes. There are many applications including, for example, food analysis in the near-infrared, plastics, organic materials, and minerals in the mid-infrared range, and signatures for a wide range of complex molecules and substances in the far infrared range.
It is a difficult range to work in as many standard materials absorb all the light in this region. This is because the light is not visible to the human eye. However, it is an extremely valuable region for many applications as the most significant and unique spectral features for most materials are found here.
Infrared spectroscopy
All the above cases may be applied to the infrared region. When implemented correctly it will provide new insights that are otherwise only accessible with far more complicated and cumbersome measurement methods.
For spectroscopic measurements in the infrared spectrum, there are many instruments available on the market. Our products offer a unique combination suitable for the darkest samples, the lowest concentrations, and the fastest reactions.